
How do you combine physical and digital event data?
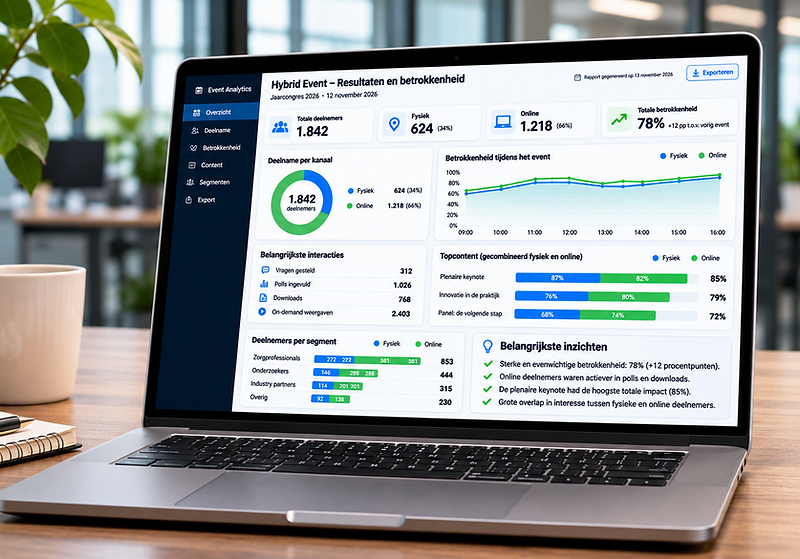
This article explains how to combine interaction data from a physical room and an online livestream into one overarching insight. Using a Visify hybrid event, it shows how that combination led to better decisions after the event.
A hybrid event produces two streams of interaction data: what happens in the room and what happens on the livestream. Both audiences leave traces, from badge scans and in-room polls to viewing behaviour and chat messages online. These two streams are usually collected and reported separately, even though combining them is exactly what helps an organiser make better informed decisions after the event.
Two data sources, two realities
In the room, data comes from registration at the entrance, scanning at session changes, live polling through a room app, and sometimes simple observations such as applause or the number of questions from the floor. This information says something about physical presence and immediate engagement, but it is often limited to snapshots per session or per space.
Online, a different kind of data appears. The streaming platform records how many viewers are watching at the same time, how long they stay, the moment they drop off, how actively they take part in polls or chat, and whether they click through on a call to action. These figures are often far more detailed than what can be measured in a physical room, but they say nothing about what actually happens inside the venue.
Why separate reports fall short
After a hybrid event, an organiser typically receives two reports: an overview from the room's registration software and an analytics report from the streaming platform. Both are accurate, but they speak different languages. The room report works with session attendance, the online report with watch time and drop-off points. Without a shared point of reference, it becomes difficult to answer a simple but essential question: which session worked better, and for whom?
As long as both reports exist separately, interpretation stays anecdotal. An organiser who suspects a particular speaker performed well cannot test that impression against comparable data. Decisions about the next event's programme then rest on gut feeling rather than a complete picture.
One timeline, one reading
The solution is not to collect more data, but to connect what already exists. By aligning both streams to the same timeline, usually the event's programme schedule, a shared structure emerges. Instead of comparing exact clock times, each session becomes the point of comparison: how many people were physically present during session X, how many watched online, and how active was each group.
It is also important to define engagement consistently across both channels. Asking a question, responding to a poll or sending a chat message can be treated, for both audiences, as a comparable signal of active participation. This turns two hard-to-reconcile documents into a single reading per session.
Looking at physical and digital data separately gives two half stories. Combining them shows what actually happened during the event.
An example from practice
At a hybrid corporate event produced by Visify, the programme included several parallel sessions aimed at both the physical and the online audience. By linking the room's per-session registration to the streaming platform's viewing data, the organiser uncovered a pattern that had stayed invisible in the separate reports. One session with strong physical turnout lost a large share of its online viewers before the end, while another session, with more modest attendance in the room, scored strongly on chat engagement and nearly complete watch time online.
That insight changed how the organiser looked at the programme. Rather than concluding that one session was simply better than the other, it became clear that certain formats suited a physical audience better, and others suited an online audience better. That understanding fed into the speaker briefing for the next edition, and into decisions about which content to prioritise in the room and which to develop primarily for the digital audience.
From insight to decision
A combined data view is not an end in itself, it is input for decisions made after the event. It helps determine which topics need a physical setting, for instance when direct interaction with leadership matters most, and which topics suit a digital approach with more room for chat and later viewing. It also guides choices about session length, the role of moderators, and how budget is split between room production and streaming technology.
Still, it is important to recognise the limits of this data. Combined interaction data reveals patterns, not complete explanations. Understanding why a session performed less well often requires additional, qualitative follow-up, such as a short survey among participants. The value of integrated data lies not in giving definitive answers, but in raising the right questions for the next edition.